Example
This page illustrates how one uses the MMC website and how the output can be retrieved and interpreted.
Format
MMC expects your data in comma-delimited (CSV) format. The objects to be clustered, e.g. genes, should appear as rows, while the observations should appear as columns. As such, please avoid names that include commas! To download an example (.csv) file please click on the following link. N.B, MMC does not support Excel or Open Office files, please export your data to CSV.
Requirments for Successful File Upload
In order to simplify the debugging process, we check for several common problems at the time of upload. You will be immediately notified if your data:
- is a non-rectangular matrix (for example, if one of your rows is missing an entry)
- if your file is larger than the currently allowed limit (default is 2001 lines but can be increased by request)
- is smaller than three lines
If your data fits any of those characteristics, you will be notified in the form.
Viewing Your Results
Once your data has completed processing, we will email you the results with the subject line "MMC Results". You will find three images/heatmaps:
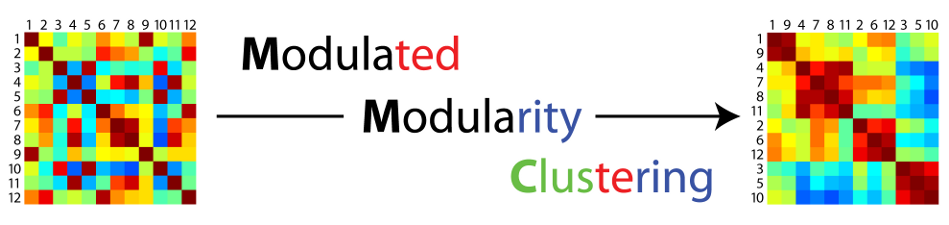
- A correlation matrix, with rows and columns ordered as in the uploaded file
- A correlation matrix, reordered so that modules are contiguous
- A "smoothed" matrix, where the entries for any pair of modules have been averaged in absolute value
You will also receive two output files: the Readme and the CSV output from the MMC process.
The Readme file contains all of the information relevant to your process. In particular, two approaches to maximizing modulated modularity are considered, and the best result among these is documented and reported.
Interpreting Your Results
The CSV output reports the clustering returned by MMC. The example file has been parsed into a spreadsheet below. The file has five columns, of which the first two are the most important. The second column reports the module number to which the gene in column one was assigned. Note that the order of the genes in column one is the order that they appear in the reordered correlation matrix. The third column, for no particular reason, reports the row that each gene occupied in the orginal uploaded file. The fourth column reports the average absolute correlation between all pairs of genes in the module; the modules are numbered 1,2,... by this value in decreasing order. The fifth column reports the average absolute correlation between the gene and the remaining genes in its module; genes are ordered within modules by this value in decreasing order.
